Conductivity of Reverse Osmosis Water: Key Facts
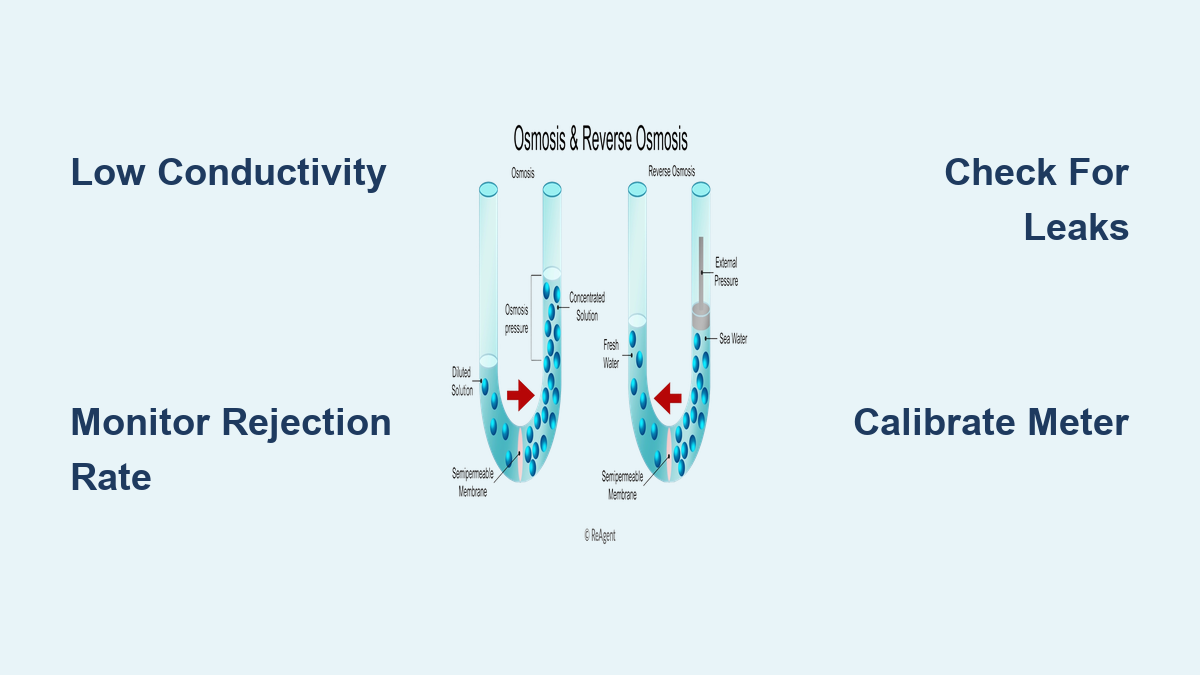
Reverse osmosis (RO) systems are trusted for producing some of the cleanest water available, from kitchen-counter filters to massive industrial plants. At the heart of this purity lies one critical measurement: the conductivity of reverse osmosis water. This metric tells you how well electricity passes through your water, which directly reflects the amount of dissolved ions still present. Lower conductivity means fewer contaminants and a more efficient membrane.
Understanding this single number helps you verify system performance, catch problems early, and confirm your water meets the standards for its intended use. In this guide, you’ll learn what conductivity means, what values to expect, how to measure it accurately, and why it matters across different industries.
How Water Conductivity Works
Why Pure Water Struggles to Conduct Electricity
Pure water is actually a terrible conductor of electricity. Without free-floating charged particles, there is nothing to carry a current between two electrodes. The moment salts like sodium, chloride, calcium, and magnesium dissolve into water, they split into ions that freely move and transmit electrical charges. The more ions present, the easier electricity flows.
Reverse osmosis works by forcing water through a semi-permeable membrane that blocks these ions. As a result, RO permeate contains far fewer charged particles, which translates directly into lower conductivity readings.
The Units Used to Measure Conductivity
Because RO water is so pure, standard units like Siemens per centimeter are too large for practical use. Instead, you will typically see measurements in:
– Microsiemens per centimeter (µS/cm): Used for purified water, drinking water, and RO permeate
– Millisiemens per centimeter (mS/cm): Used for saltier solutions like seawater or industrial brine
– Resistivity (MΩ·cm): Used for ultrapure water, where 18 MΩ·cm equals 0.055 µS/cm, the theoretical limit of purity
Why Temperature Changes Your Readings
Conductivity is highly sensitive to temperature. Readings increase by roughly 2% for every 1°C rise. A sample measured at 30°C will read about 10% higher than the same sample at 25°C. To eliminate this variability, all measurements are normalized to a reference temperature of 25°C using automatic temperature compensation (ATC). Always use meters equipped with ATC to avoid false readings.
Typical RO Water Conductivity Levels

What Counts as Normal for RO Systems
Most reverse osmosis systems produce permeate with conductivity between 5 and 50 µS/cm, though this range depends on feedwater quality and membrane condition. To put this in perspective:
| Water Type | Conductivity (µS/cm) |
|---|---|
| Ultrapure Water | 0.055 |
| Double-Pass RO | <1.0 |
| Distilled Water | 1–5 |
| RO Permeate | 5–50 |
| Tap Water | 200–800 |
| Seawater | ~50,000 |
A well-functioning residential RO system should reduce tap water conductivity by 90–99%. If your tap water reads 400 µS/cm, your RO output should fall between 4 and 40 µS/cm.
Single-Pass vs. Double-Pass RO Systems
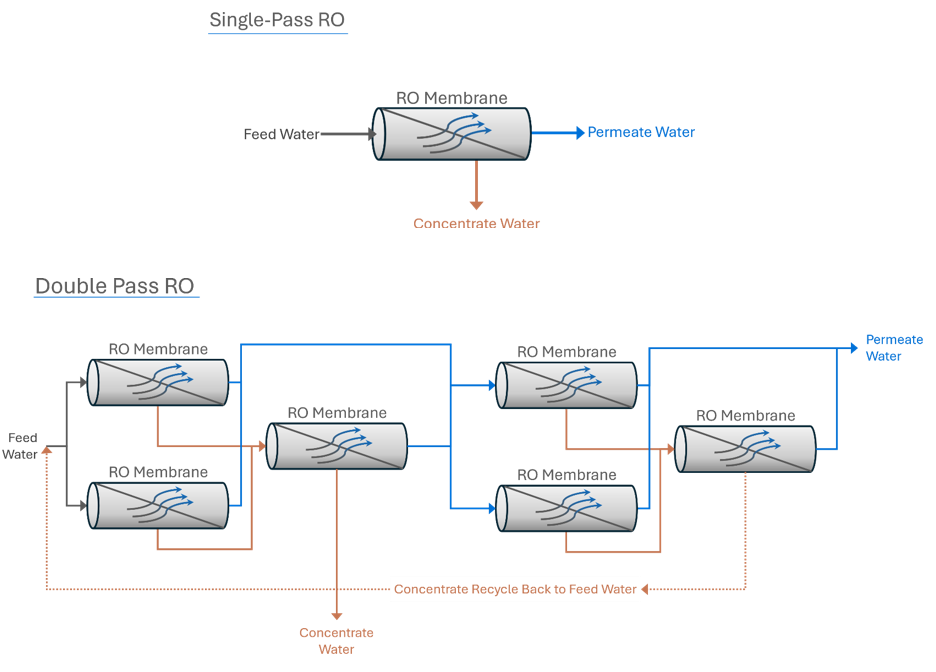
- Single-pass RO sends water through one membrane stage, achieving 5–50 µS/cm. This is standard for homes and general industrial use.
- Double-pass RO adds a second membrane stage, pushing conductivity below 1 µS/cm. This is essential for pharmaceuticals, microelectronics, and other ultrapure applications.
Membranes with higher rejection rates (99% versus 95%) produce noticeably lower conductivity water and are critical when purity cannot be compromised.
Conductivity vs. TDS: What’s the Difference?
Two Different Ways to Measure the Same Thing
Conductivity and total dissolved solids (TDS) are closely related but measure different properties:
– Conductivity measures the water’s ability to carry an electrical current, which is an indirect indicator of ion concentration
– TDS measures the actual mass of dissolved solids, expressed in mg/L or ppm
Since more dissolved ions lead to both higher conductivity and higher TDS, the two values rise and fall together.
Converting Between Conductivity and TDS
You can estimate TDS from conductivity using a simple formula:
TDS (ppm) ≈ Conductivity (µS/cm) × Conversion Factor
The conversion factor depends on which ions dominate your water:
– Sodium chloride-dominated water: 0.64
– Natural freshwater: 0.55–0.75
– Brackish water: 0.45–0.60
Most handheld meters automatically apply a factor between 0.5 and 0.7. For the most accurate results, calibrate your meter using a standard that matches your specific water chemistry.
Why Conductivity Matters in RO Systems
A Real-Time Window into Membrane Performance
Conductivity is the fastest way to verify that your RO membrane is doing its job. By comparing feedwater and permeate readings, you can calculate salt rejection percentage:
Rejection (%) = [(Feed − Permeate) / Feed] × 100
A new membrane should reject 95–99% of dissolved ions. If rejection drops below 90%, the membrane likely needs cleaning or replacement.
Catching Problems Before They Get Worse
Rising conductivity is often the first sign of trouble. Watch for these patterns:
– Gradual increase over time: Suggests membrane fouling or scaling
– Sudden jump: Points to seal failure or mechanical damage allowing untreated water to bypass the membrane
– Rapid spike after system changes: May indicate chlorine damage to polyamide membranes
– Consistently high readings: Could mean physical tears in the membrane from abrasive particles
Regular monitoring helps you address these issues before water quality is compromised.
Meeting Industry Standards and Regulations
Different sectors enforce strict conductivity limits to ensure safety and product quality:
| Industry | Maximum Conductivity | Application |
|---|---|---|
| Drinking Water | <500 µS/cm | WHO safety and taste guidelines |
| Pharmaceuticals | <1.3 µS/cm | USP Purified Water standards |
| Electronics | <0.1 µS/cm | Wafer cleaning and semiconductor production |
| Power Plants | <0.1–10 µS/cm | Boiler feedwater protection |
| Food & Beverage | Variable, generally low | Consistent taste and equipment longevity |
Exceeding these limits can lead to product defects, equipment damage, or regulatory violations.
How to Measure RO Water Conductivity Correctly
Choosing the Right Meter for Your Application
Different tools suit different needs:
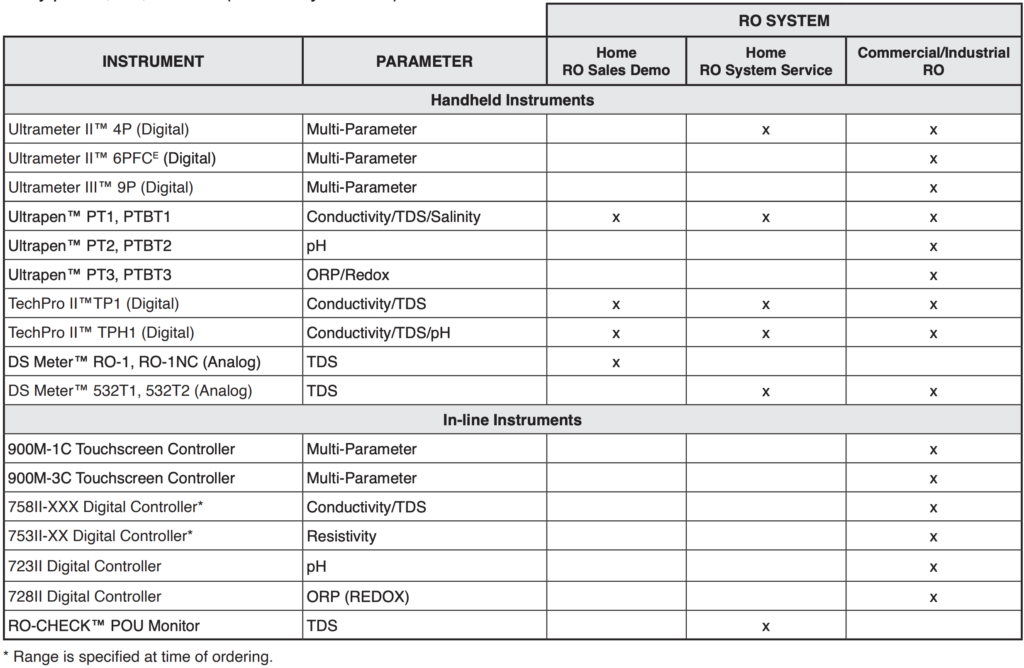
– Handheld TDS meters: Affordable and convenient for home use and quick spot checks. Look for models with ATC and calibration options.
– Inline sensors: Built into industrial systems for 24/7 monitoring with 4-20mA output signals.
– Lab-grade meters: Required for ultrapure applications, offering precision down to 0.01 µS/cm.
Avoid cheap, uncalibrated pens. They drift easily and produce unreliable readings.
Avoiding Common Measurement Pitfalls
Measuring low-conductivity RO water requires care:
– CO₂ absorption: Exposed samples absorb carbon dioxide from the air, forming carbonic acid that raises conductivity. Test samples immediately in sealed flow cells.
– Contaminated containers: Use clean high-density polyethylene or glass vessels, rinsed with RO water beforehand.
– Dirty probes: Residue or biofilm on sensors skews results. Clean probes monthly with mild acid or detergent.
For ultrapure water, flow-through cells minimize atmospheric exposure and keep readings accurate.
Calibrating Sensors for Reliable Results
Calibrate your equipment using standard solutions:
– 1413 µS/cm or 12.88 mS/cm for general applications
– Low-range standards (such as 100 µS/cm) specifically for RO water
Follow manufacturer guidelines carefully. Many industrial sensors include self-diagnostic features that alert you when calibration is due.
Troubleshooting High RO Conductivity

Start with the Feedwater
Before assuming the membrane is at fault, check your incoming water:
– Measure feedwater conductivity. Has it increased recently?
– Verify that sediment and carbon pre-filters are functioning. Clogged filters reduce membrane protection.
– Test for chlorine. Levels above 0.1 ppm can damage polyamide membranes.
Calculate Your Current Rejection Rate
Use the rejection formula to assess membrane health. If your feed is 300 µS/cm and permeate is 30 µS/cm:
(300 − 30) / 300 = 90% rejection
Anything below 90% warrants further investigation.
Inspect Seals and Connections Carefully
Small bypass leaks can dramatically raise conductivity. Check the following:
– Brine seals: Look for rolling, twisting, or visible wear
– O-rings: Inspect for cracks, swelling, or chemical degradation
– End adapters: Ensure proper fit and compression
Test Individual Membrane Vessels
Use a portable meter to sample permeate from each pressure vessel individually. If one vessel shows significantly higher conductivity than the others, isolate and replace that specific membrane element.
Maintenance Tips to Keep Conductivity Low
Establish a Baseline and Track Trends
Record conductivity at multiple checkpoints throughout your system:
– Raw feedwater intake
– RO inlet
– RO permeate
– Final product water
Log readings daily or weekly. A gradual upward trend suggests fouling. A sudden spike signals mechanical failure.
Clean Membranes Based on What the Data Tells You
Match your cleaning approach to the problem:
– Slow conductivity rise (fouling): Clean with acid for scaling or detergent for organic buildup
– Biofouling: Apply biocides like sodium bisulfite
– Frequency: Every 3–6 months, or as trends indicate
Don’t wait for pressure drop to alert you. Conductivity changes often appear first.
Replace Worn Components on Schedule
Preventive replacement keeps your system running smoothly:
– Change O-rings and brine seals every 1–2 years
– Replace carbon and sediment filters every 6–12 months
– Verify antiscalant dosing to prevent scale formation
Good pre-treatment extends membrane life and preserves low conductivity output.
Applications of Low-Conductivity RO Water
Residential Drinking Water
RO systems reduce tap water conductivity from 200–800 µS/cm down to 5–50 µS/cm. This removes excess minerals that cause hardness and unpleasant flavors, leaving crisp, clean-tasting water.
Pharmaceutical Manufacturing
Purified water used in drug formulation must meet USP standards of less than 1.3 µS/cm conductivity. RO serves as the first purification step, often followed by deionization. Continuous monitoring ensures compliance with FDA regulations.
Semiconductor and Electronics Production
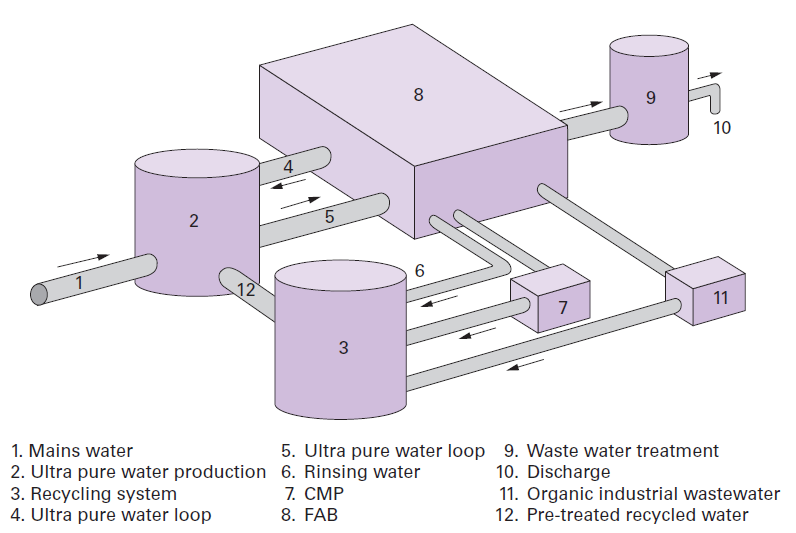
Wafer cleaning demands ultrapure water with conductivity below 0.1 µS/cm. Even trace ions can cause micro-defects that ruin sensitive components. Double-pass RO combined with mixed-bed polishing delivers the required purity.
Power Generation
High-pressure boilers rely on RO water with conductivity below 1 µS/cm to prevent scaling and corrosion. Impurities can lead to tube failures, costly downtime, and reduced equipment lifespan.
Food and Beverage Production
Bottled water, beer, and soft drinks use RO to standardize water chemistry. Low conductivity ensures consistent flavor profiles and extends the life of processing equipment by minimizing scale buildup.
Key Technical Specifications at a Glance
| Parameter | Value |
|---|---|
| Standard Unit | µS/cm |
| Reference Temperature | 25°C |
| Temperature Coefficient | +2% per °C |
| Ultrapure Water Limit | 0.055 µS/cm |
| Typical RO Output | 5–50 µS/cm |
| TDS Conversion Factor | 0.5–0.7 |
| Industrial Sensor Material | Titanium |
| Output Signal | 4-20mA or digital |
| High-Precision Accuracy | Down to 0.01 µS/cm |
Frequently Asked Questions About Conductivity of Reverse Osmosis Water
What is a good conductivity reading for RO water?
A good conductivity reading for RO permeate typically falls between 5 and 50 µS/cm. For ultrapure applications like pharmaceuticals or electronics, readings should be below 1.3 µS/cm or even below 0.1 µS/cm. If your reading is consistently above 50 µS/cm, your membrane may need attention.
Why does temperature affect conductivity readings?
Conductivity increases by about 2% per degree Celsius because ions move more freely in warmer water. To compare readings accurately, all measurements are normalized to a reference temperature of 25°C using automatic temperature compensation.
How often should I calibrate my conductivity meter?
Calibrate handheld meters monthly or before critical measurements. Industrial inline sensors often include self-diagnostic alerts when calibration is needed. Always use calibration standards appropriate for your water type, such as 1413 µS/cm for general use or 100 µS/cm for RO-specific applications.
What causes RO permeate conductivity to suddenly spike?
A sudden spike usually indicates mechanical failure rather than gradual fouling. Common causes include damaged O-rings, displaced brine seals, cracked end adapters, or physical tears in the membrane. Inspect all seals and connections immediately, and test individual pressure vessels to isolate the problem.
Is low conductivity water safe to drink?
Yes, RO water with low conductivity is safe and commonly consumed in households worldwide. However, it also removes beneficial minerals like calcium and magnesium. Some people choose to remineralize RO water for taste or health reasons, but the water itself meets strict safety standards when properly produced.
Can I use a TDS meter instead of a conductivity meter?
TDS meters actually measure conductivity and apply a conversion factor to estimate total dissolved solids. They work well for general home monitoring but may lack the precision needed for industrial or laboratory applications. For accurate low-range readings on RO water, a dedicated conductivity meter is the better choice.
Final Thoughts on Managing RO Water Conductivity
The conductivity of reverse osmosis water is more than just a number. It is a direct reflection of your system’s health, your membrane’s condition, and your water’s suitability for its intended purpose. By monitoring this metric regularly, you can verify that your RO system is performing as designed, catch problems before they escalate, and maintain compliance with industry standards.
Start by establishing a baseline reading for your system, then track changes over time. Invest in a quality meter with automatic temperature compensation, and calibrate it on a consistent schedule. Whether you are maintaining a simple under-sink filter or managing a large industrial plant, understanding conductivity gives you the insight needed to produce consistently pure water.
Take fifteen minutes today to measure your RO permeate conductivity and compare it against the expected range. That single reading could be the first step toward better water quality and longer membrane life.