Does Reverse Osmosis Remove Nanoplastics?

Nanoplastics have been detected in nearly every water source on Earth, from rainwater to tap water to bottled beverages. These invisible particles, smaller than 1 micrometer, can penetrate deep into human tissues and organs, raising serious concerns about long-term health effects. With growing awareness, consumers are asking: does reverse osmosis remove nanoplastics? The answer is a clear yes, when the system is properly maintained. Reverse osmosis is the most effective household filtration method available, capable of removing over 99% of nanoplastics and nearly 100% of microplastics. This guide explains how RO achieves this, compares it to other filters, and reveals critical maintenance steps to ensure your system protects rather than contaminates your water.
How RO Blocks Nanoplastics at the Membrane Level
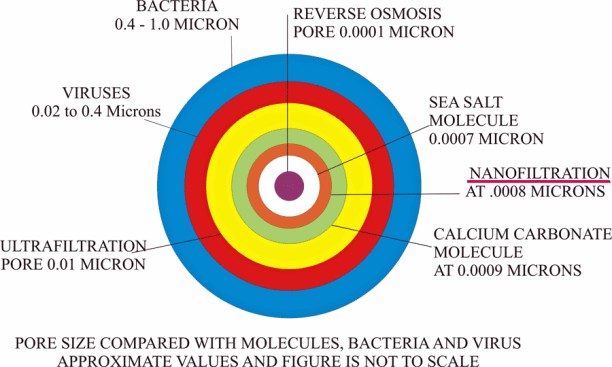
Reverse osmosis removes nanoplastics through size exclusion, a physical barrier that stops particles larger than the membrane’s pore size. Standard thin-film composite (TFC) RO membranes have an effective pore size of 0.0001 microns (0.1 nanometers). In contrast, nanoplastics range from 1 to 1,000 nanometers, making them up to 10,000 times larger than the pores. Even the smallest nanoplastics at 100 nm are still 1,000 times bigger than the membrane openings, meaning they physically cannot pass through an intact RO membrane.
Why Size Exclusion Outperforms Chemical Filtration
RO does not rely on chemical attraction or absorption. Instead, it uses high-pressure water flow to push H₂O molecules through the semi-permeable membrane while blocking contaminants. Since nanoplastics are solid particles, they remain trapped in the wastewater stream and flush down the drain. A 2024 study published in Nature Nanotechnology confirmed RO is the only household technology capable of consistently removing nanoplastics below 100 nm.
Real-World Removal Rates Backed by Research
- Nanoplastics: over 99% removal
- Microplastics: over 99.9% removal
- Confirmed by: a 2019 tap water study and multiple peer-reviewed analyses
These rates assume a fully functional system with no membrane damage or bypass. Unlike carbon filters or UV systems, RO physically removes particles rather than just disinfecting or adsorbing them.
Compare RO to Other Filtration Technologies
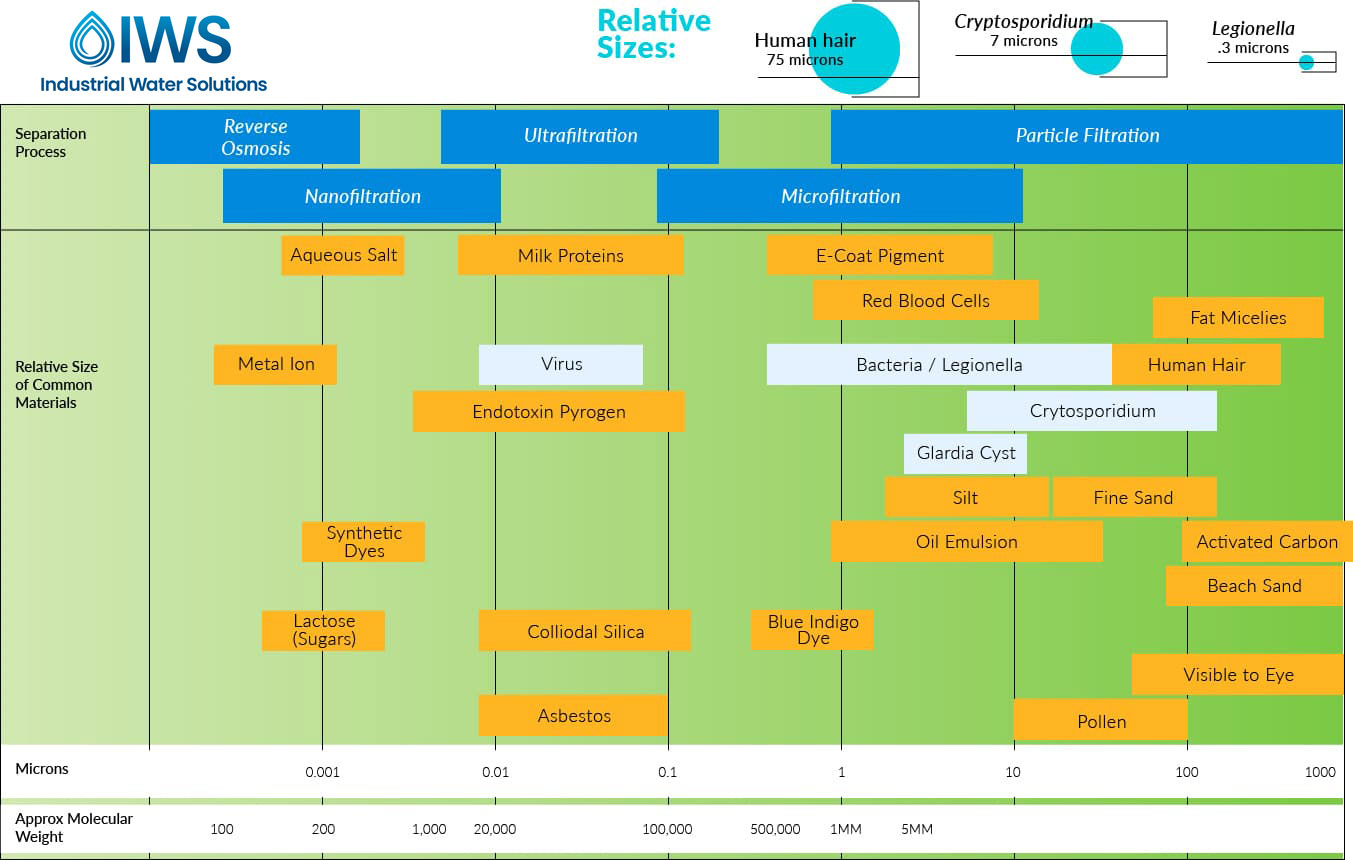
Not all filters are created equal. Most common household systems fail to capture nanoplastics due to large pore sizes or incorrect mechanisms.
Filter Efficacy by Type
| Technology | Nanoplastic Removal | Microplastic Removal | Pore Size |
|---|---|---|---|
| Reverse Osmosis | Over 99% | Over 99.9% | 0.0001 µm |
| Nanofiltration | 90–95% | 99% | 0.001 µm |
| Ultrafiltration | 60–80% | 95–99% | 0.01 µm |
| Carbon Block | 10–30% | 60–80% | 0.5–10 µm |
| Pitcher Filters | Under 5% | 30–50% | 20–50 µm |
Why Most Household Filters Fall Short
- Pitcher and fridge filters use activated carbon with pores too large to catch nanoplastics
- Boiling water kills germs but leaves plastics behind, and evaporation may concentrate them
- UV light disinfects but provides zero particle removal
- Sediment filters only catch large debris, missing anything under 1 micron
Only membrane-based systems (RO, nanofiltration, ultrafiltration) can effectively block nanoplastics. Among them, RO stands alone in removing particles below 100 nm.
Tap vs Bottled Water: The Plastic Paradox

Many assume bottled water is safer. The opposite is true based on recent research.
Contamination Levels Per Liter
| Source | Nanoplastics | Microplastics |
|---|---|---|
| Bottled Water | ~240,000 | ~100 |
| Tap Water (US Avg) | 0–15 | 5–15 |
| RO-Filtered Tap | Under 1 | Under 1 |
A 2024 Columbia University study found bottled water contains 10 to 100 times more nanoplastics than previously reported. The primary source is the plastic bottle and cap, which shed particles when twisted or exposed to heat.
Why RO-Filtered Tap Water Is the Clear Winner
- Removes over 99.9% of existing microplastics and nanoplastics
- Avoids plastic packaging entirely
- Costs less per liter than bottled water
- Environmentally sustainable with no single-use plastics
Switching from bottled to RO-filtered tap water reduces nanoplastic intake by over 99.9%.
Hidden Risk: RO Membranes Can Shed Plastics

While RO removes nanoplastics, a critical paradox exists: the filter itself can become a source of contamination as it ages.
Membrane Degradation and Shedding Explained
RO membranes are made of polyamide plastic. Over time, especially with poor maintenance, they degrade and begin shedding micro and nanoplastics into the filtered water. A 2023 Chemosphere study found aging RO membranes can release polymer fragments, turning the system from protector to polluter.
Warning Signs of Membrane Failure
- Drop in TDS rejection below 85%
- Noticeable taste or odor changes
- Reduced water flow
- Age over 3–5 years
Prevent Membrane Shedding with These Steps
- Replace membranes every 3–5 years, depending on water hardness and usage
- Monitor TDS rejection monthly using a $20 meter
- Pre-filter incoming water to reduce fouling from sediment and chlorine
- Avoid chlorinated water without a carbon pre-filter, since chlorine damages polyamide membranes
A failing membrane not only reduces plastic removal but may add plastic particles to your drinking water.
Avoid Recontamination After Filtration
Even with a perfect RO membrane, your water can become recontaminated downstream.
Post-RO Contamination Sources to Watch
- Plastic storage tanks: Most RO systems use polyethylene or polypropylene tanks
- PEX plumbing: Cross-linked polyethylene pipes may leach plastics
- Plastic tubing: Internal hoses can degrade over time
- Dispensing faucets: Plastic components in the faucet may shed
How to Stay Protected After Filtration
- Use glass or stainless steel storage for drinking water
- Minimize plastic tubing length in the system
- Install a post-filter, like an activated carbon block, to catch any shed particles
- Choose RO systems with non-plastic contact surfaces where possible
Post-filtration carbon blocks are standard in most residential RO units and help capture any particles from membrane or tubing degradation.
Choose the Right RO System for Your Home
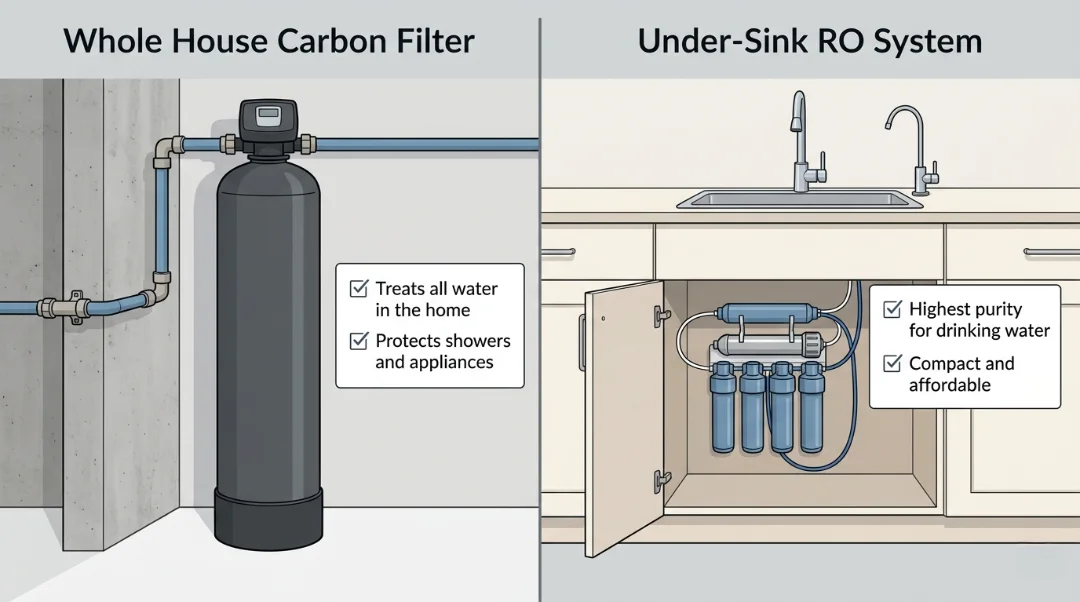
Not all RO systems offer equal protection. Selecting the right one ensures long-term nanoplastic removal.
Point-of-Use vs Whole-House Comparison
| System Type | Best For | Cost | Nanoplastic Protection |
|---|---|---|---|
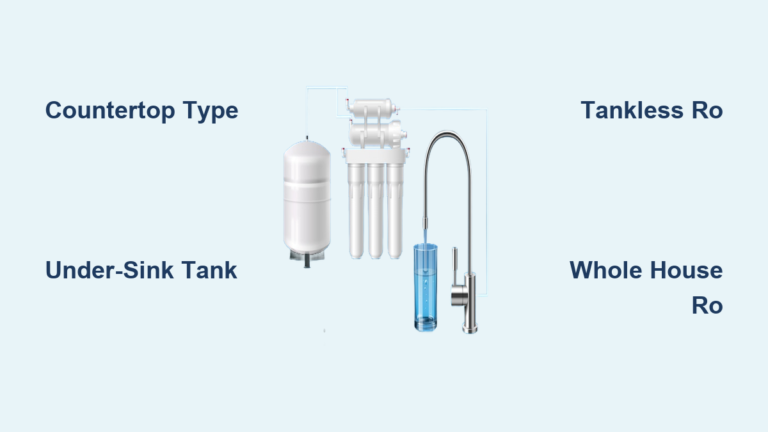
| Under-Sink RO | Drinking and cooking water | $150–$600 | Full protection at tap |
| Whole-House RO | All household water | $2,000–$8,000 | Total home coverage |
Under-sink RO is the most cost-effective way to protect drinking water. Whole-house systems eliminate nanoplastics from showers, laundry, and appliances, reducing skin exposure and microfiber release during washing.
Features to Look for in a Quality System
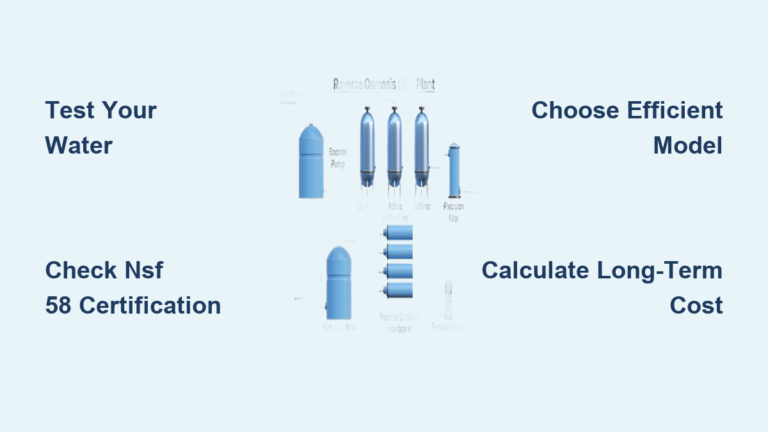
- ANSI/NSF 58 certification: Ensures contaminant reduction claims are verified
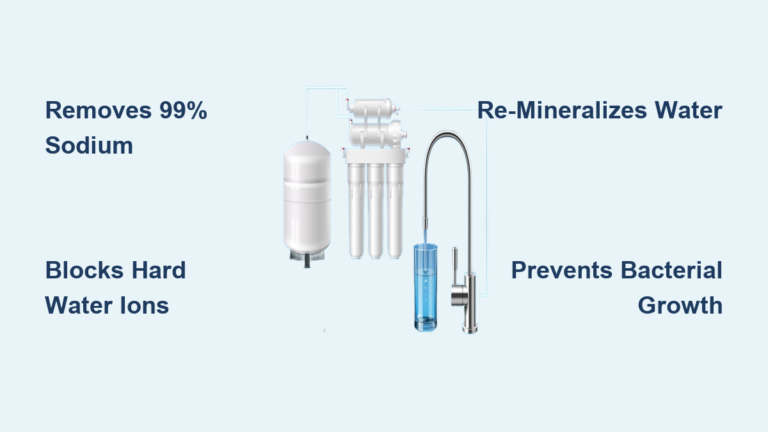
- Multi-stage filtration: Sediment + carbon pre-filters + RO membrane + post-carbon
- TDS meter included: For easy performance monitoring
- Remineralization stage: Replaces beneficial minerals removed by RO
Maintain Your RO System for Peak Performance
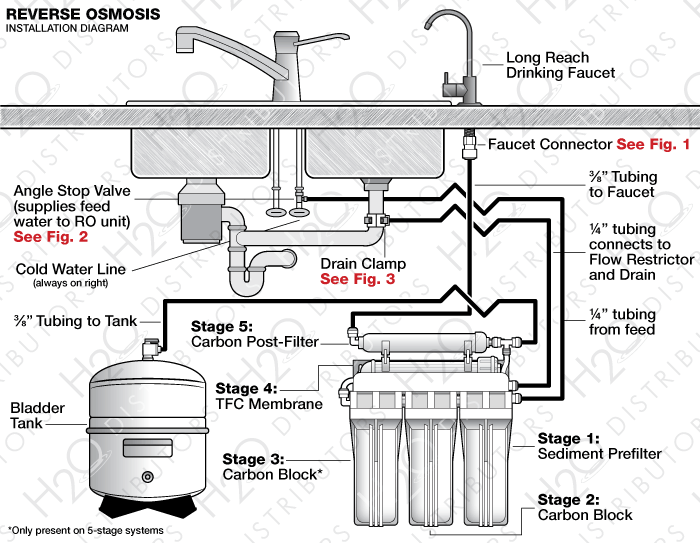
RO systems require regular upkeep to stay effective against nanoplastics.
Maintenance Schedule by Component
| Component | Replacement Interval | Purpose |
|---|---|---|
| Sediment Pre-Filter | Every 6 months | Traps sand, rust, debris |
| Carbon Pre-Filter | Every 6–12 months | Removes chlorine, VOCs |
| RO Membrane | Every 3–5 years | Blocks nanoplastics, TDS |
| Post-Carbon Filter | Every 6–12 months | Polishes taste, captures shed particles |
Check Performance Monthly with a TDS Meter
- Test input and output water each month
- Calculate rejection rate:
(Inlet TDS – Outlet TDS) / Inlet TDS × 100
Example: (300 – 10) / 300 = 96.7% rejection - Replace membrane if rejection drops below 85%
Since TDS ions are smaller than nanoplastics, a membrane that rejects 90–99% of TDS guarantees over 99.9% microplastic and nanoplastic removal.
RO Removes More Than Just Plastics
Beyond nanoplastics, RO filters out a wide range of harmful contaminants:
- Heavy metals: Lead, arsenic, cadmium
- PFAS/PFOS: “Forever chemicals” from industrial runoff
- Nitrates: From agricultural fertilizers
- Fluoride: In areas with high natural or added levels
- Pharmaceuticals: Trace residues in municipal water
This broad protection makes RO one of the most comprehensive home water treatments available.
Understand the Cost of Clean Water
RO systems involve both upfront and ongoing costs.
Price Breakdown for Typical Installation
- Under-sink unit: $150–$600
- Installation: $100–$300 if not DIY
- Annual filter replacements: $100–$200
- Membrane replacement: $75–$150 every 3–5 years
Water Waste and Efficiency Considerations
- Ratio: 5–6 gallons wasted per 1 gallon purified
- Solutions: Use waste water for gardening, install permeate pumps, or choose low-waste models with a 3:1 ratio
In drought-prone areas, consider remineralized RO systems with permeate pumps to improve efficiency.
Remineralization: Replace Lost Minerals
RO removes beneficial minerals like calcium, magnesium, and potassium.
Health Implications of Demineralized Water
- Long-term consumption may affect bone and cardiovascular health
- Distilled or RO water is more acidic and aggressive in leaching metals from pipes
Solutions for Mineral Replacement
- Integrated remineralization filters: Add back calcium and magnesium
- Alkaline RO systems: Raise pH and improve taste
- Mineral drops or tablets: Add to water after filtration
Choose systems with certified remineralization stages to ensure balanced, healthy water.
Regulatory Gaps and Future Outlook
As of 2026, no federal limits exist for microplastics in U.S. drinking water.
Current Regulatory Status
- EPA: Researching health effects with no enforceable standards
- California: First state to require microplastic testing in public water systems
- WHO: Recommends monitoring but lacks regulatory thresholds
Industry Shifts Worth Noting
- Bottled water decline: Consumers switching to RO due to high nanoplastic content
- Certification demand: Growth in NSF/ANSI 58-certified systems
- Detection tech: New methods enabling accurate nanoplastic measurement
Regulations are expected within the next 5–10 years as evidence mounts.
Frequently Asked Questions About Reverse Osmosis and Nanoplastics
Can boiling water remove nanoplastics?
No. Boiling kills bacteria but does nothing to remove plastic particles. Plastics are heat-resistant well above 100°C, and boiling may actually concentrate nanoplastics as water evaporates.
Do fridge filters stop nanoplastics?
No. Most use carbon with 5–20 micron pores, which are too large to capture nanoplastics. These filters are designed for taste improvement, not particle removal.
How do I test if my RO system is working?
Use a TDS meter to measure input and output water. A rejection rate above 90% means the membrane is intact and effectively removing nanoplastics.
Is tap water safer than bottled water?
Yes. Tap water contains 5–15 particles per liter versus approximately 240,000 in bottled water. RO-filtered tap water is the safest option available.
Can coffee filters catch microplastics?
Paper filters may trap some larger microplastics above 10 µm, but they cannot capture nanoplastics. Using RO water as your brewing input provides the best defense.
Do RO systems need electricity to operate?
Most use household water pressure alone. High-efficiency or low-pressure models may need a booster pump, which uses minimal electricity.
Key Takeaways for Removing Nanoplastics With Reverse Osmosis
Reverse osmosis is the gold standard for nanoplastic removal, achieving over 99% efficiency when properly maintained. The system works through size exclusion, physically blocking particles at the membrane level where pores are 1,000 times smaller than even the smallest nanoplastics. However, the membrane itself can shed plastics as it ages, making regular TDS monitoring and timely replacement essential every 3–5 years.
For the cleanest, safest water possible, pair your RO system with glass storage containers and a post-carbon filter to catch any shed particles. Test your system’s rejection rate monthly, replace pre-filters every 6–12 months, and consider a remineralization stage to restore beneficial minerals. Start by checking your current TDS rejection rate today, since this single measurement tells you whether your drinking water is truly protected against the invisible threat of nanoplastics.